
A Little Friday Breather

Good Sunday Morning! Hope everyone is having a great weekend!
Friday the market took a breather after a week straight of green days. More than do for a breathe in order to continue with the next leg up. Spy daily chart on the left and weekly on the right.

Friday was a perfect example of why I am not a fan of trading Fridays. The market makers manipulate the market more so to kill weekly options. The house at a casino always wins the most and it’s the same in the stock market so Fridays you’ll notice tickers being pinned to a certain price or the market may be stop loss hunting to take out stop loses. That is why I stick to inside day trades and even that I don’t always do. This past Fridays inside day trades half worked. A call would trigger and then reverse so you had to be real quick. In weak markets like Friday I don’t play the call triggers. I had 2 or 3 triggers go off to the upside and then later in the day they triggered to the downside. So again they can work and both sides at that but you have to be quick. Nvax to the downside was a good inside day winner from last Friday.
The market was full of chop and drop and failed climbs on Friday. So to start this blog I just want to start with revisiting the swing ideas that I put out on Thursday. I want to go a little more in depth on what I see. Since I don’t do a whole lot of day trading on Friday I start to look for new set ups for swing trades on Thursday after market close. You always have to have a plan and stick to your plan. Then you have to know when to pull the trigger, both to buy and when you should sell even if it is at a loss. Every trader approaches the market differently and that is the beauty of the market. Stick to what is working for you. The slight pull back on Friday was needed and I still like the trade ideas I put out. I just want to explain them in better detail. I use bollinger bands, an MA cloud, vwap, the 9, 21, 55 Emas, and the Zero line Ema (indicator in Trendspider) in my trading. I use other indicators like macd, rsi and W%R occasionally also.

Dis (daily chart on left/weekly on right) - To make the charts a bit cleaner to look at I have got rid of my Emas except for the zero line ema which is the white line. I prefer to start a swing position when price is over my white line and for better confirmation when the candle closes. However looking at Dis if it opens around this price on Monday I will take a starter position here. Price may not be over the zero line on the daily or the weekly but if you look at the weekly chart, price dropped on Friday right where it was supposed to in order to stay consolidating in the channel it is in. Dis is right at the bottom of the channel. Rsi is at a 37 so it is getting to be oversold and it would make sense to bounce here at the bottom of the channel and right at the bottom band on both time frames.
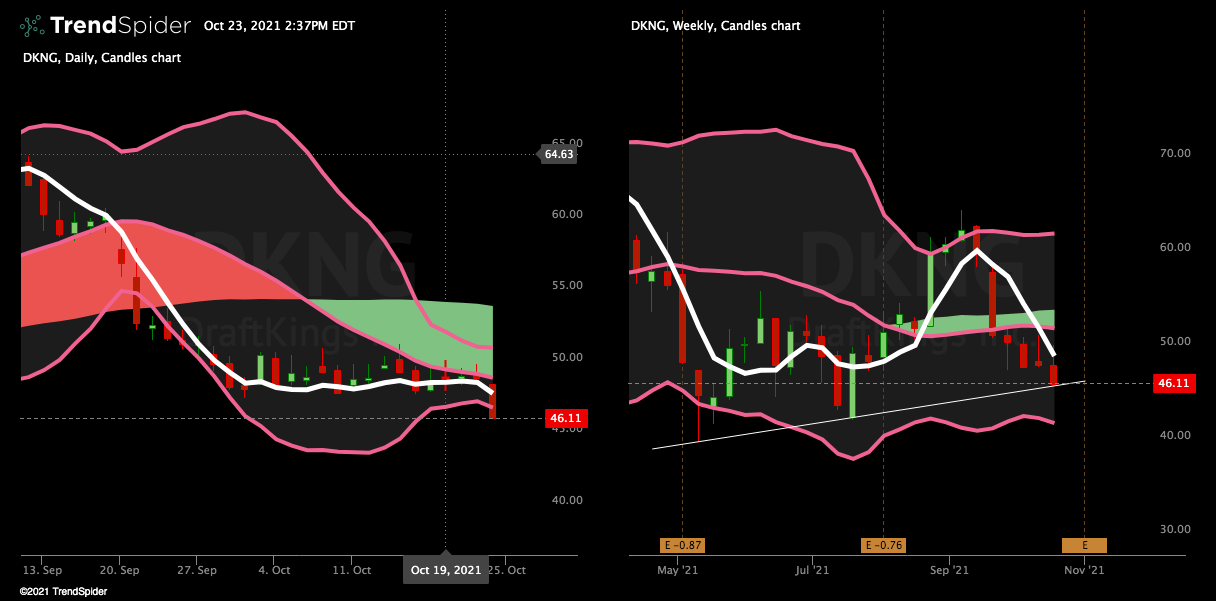
Dkng (daily on left/weekly on right) - Like Dis this also isn’t above my white line which I would prefer but also like Dis it has also stopped right at a trend line on Fridays dip. If it bounces here it should make for a good trade. Rsi under 30 so this thing is a bit oversold and due for a bounce. Earnings in early November so let’s see if this can finally start to move to the upside.
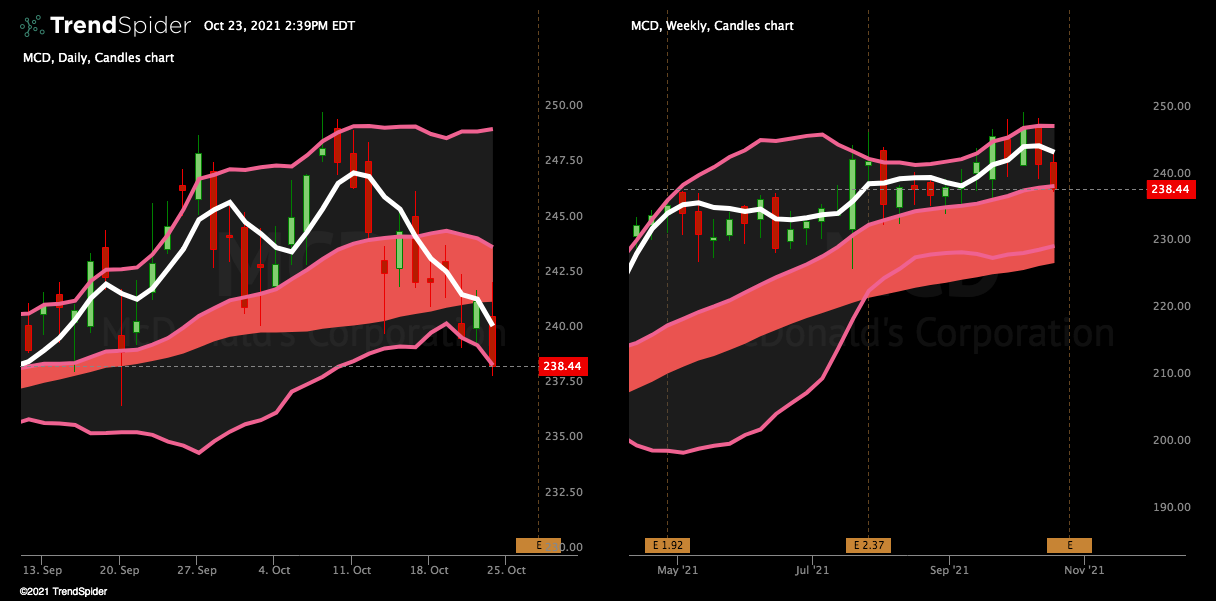
Mcd (daily on left/weekly on right) - Again not above my white line. But when it makes sense to me to hop in a trade before it gets to the line I do. Everyone has different risk levels. Take a look at the white line though on all charts I post. You’ll notice when a candle closes over it specifically on the daily then it heads higher. Which is why I like to wait for confirmation. However at the same time if the set up looks right and everything lines up to me I will enter a trade early and average in if needed. Mcd I’m liking the least out of the three but I still like it. Came down with the market on Friday but if you look at the weekly it stopped right at the cloud so this should make for a perfect bounce spot. If it falls through the cloud though personally I wouldn’t touch it. Rsi at a 36 on the daily so just like Dis and Dkng this is also starting to be oversold. I’m watching for a bounce here and will take it from there.
Some More Swing Ideas
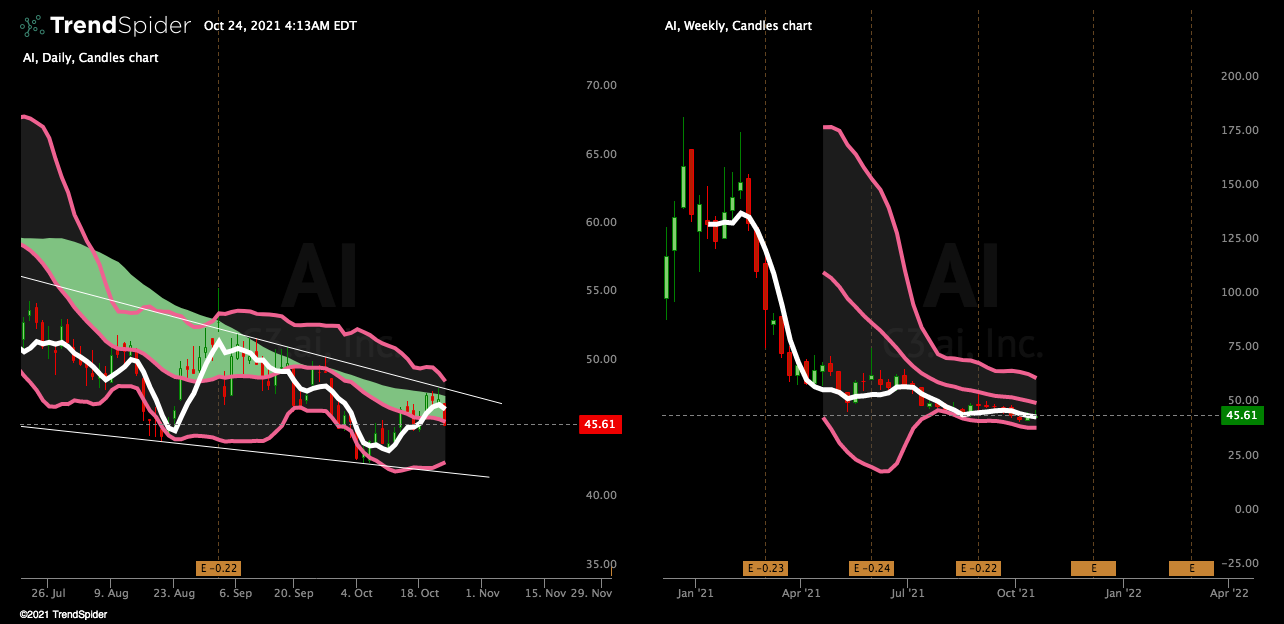
Ai (daily on left/weekly on right) - Currently sitting at mid band on the daily. Wouldn’t be surprised if it touches lower band again first around $43. Which happens to line up with the bottom trend line. I want to put these ideas out before it’s too late. Don’t chase plays. Set alerts and remember why you set them and let your play come to you. Ai is so tight and a breakout is coming I feel. If it comes back down to bottom band on the daily and bounces then I think next time up to the top trend line it should breakout.
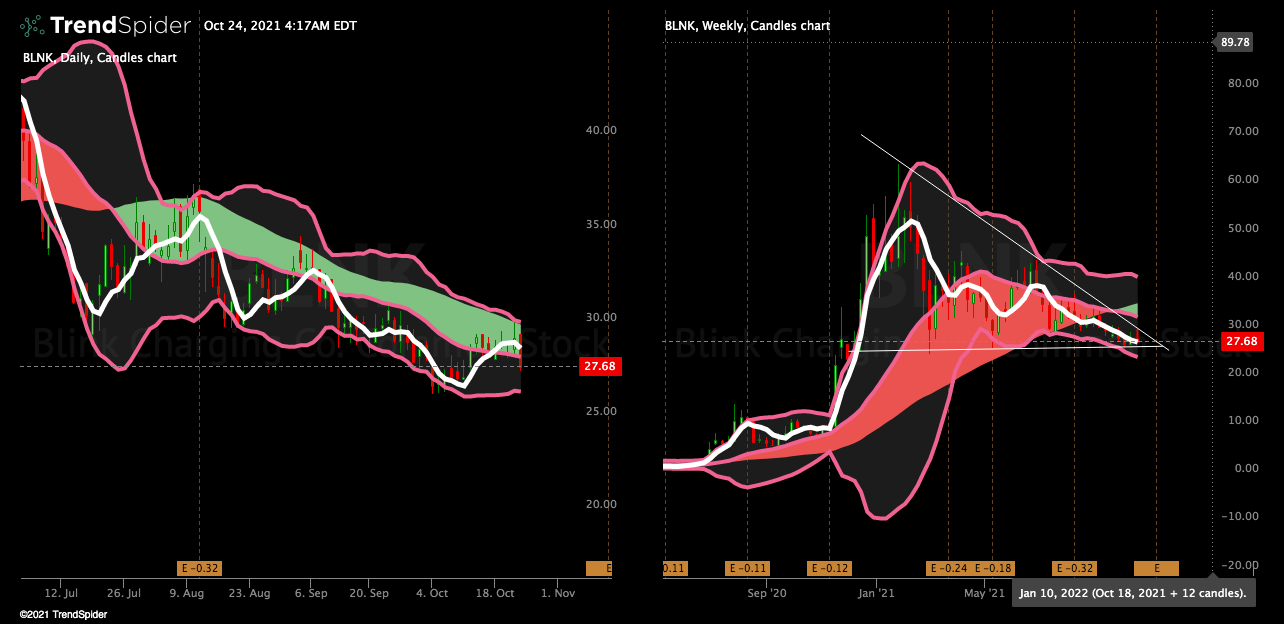
Blnk (daily left/weekly right) - Also really tight like Ai. If it comes down to the bottom band on the weekly it actually puts it just above bottom band on the daily for a bounce off the trend line. Which would make sense to bounce after hitting both bottom bands first. You could play this or the other plays off the trend line and ride its ups and downs to mid band then top band then hopefully breakout. Or if it breaks through trend line you can play puts but I wouldn’t hold puts as long as I would calls especially in a bull market.
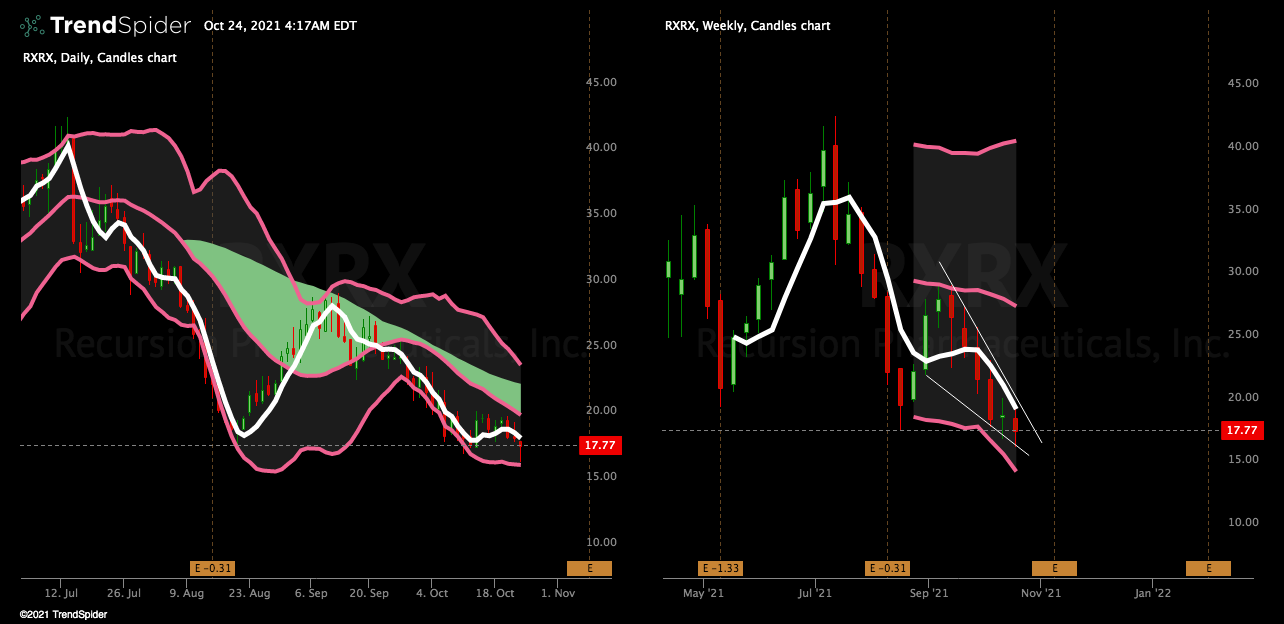
Rxrx (daily left/weekly right) - Weekly looking pretty in the falling wedge that it is in. My Zero Line Ema on the weekly is sitting at 19.49 which coincidently puts it right at the top trend line. A break of that should send this moving. We might have time on this one. Zero Ema on the daily is 18.34. If you want to get in early I would at least wait for a close over that.
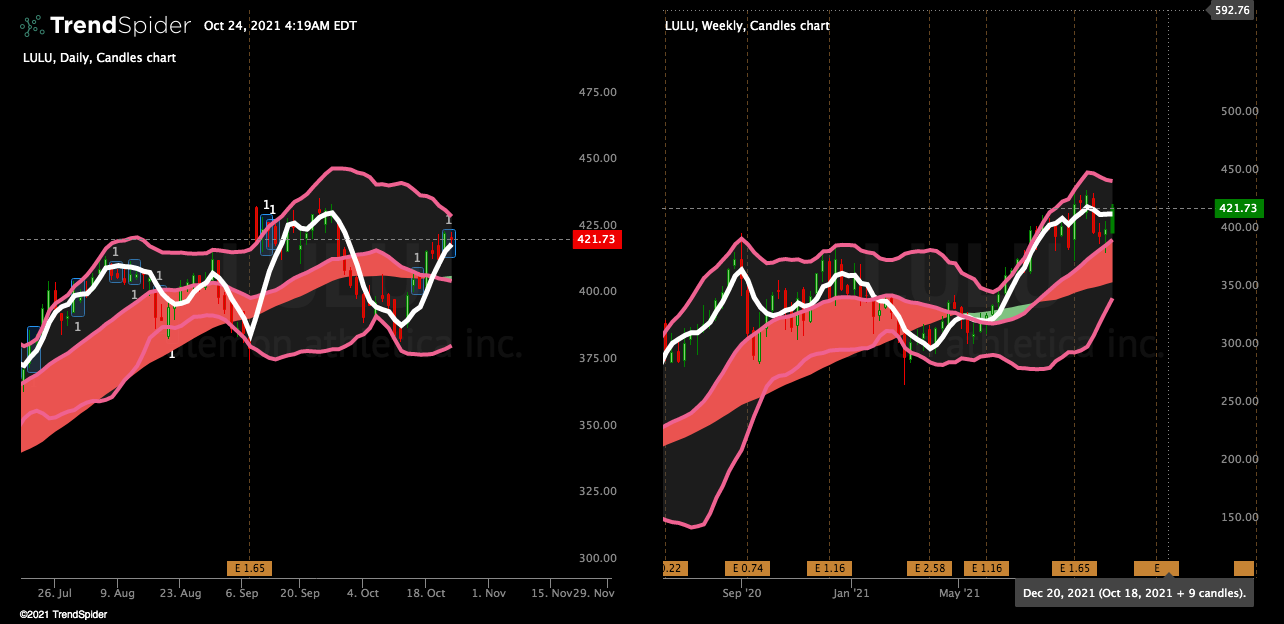
LuLu (daily left/weekly right) - LuLu stock has been a favorite for a long time. Looking good still just like Dash, Crm and afrm. Just want to point out with Lulu is that it put an inside day in on Friday. A break of that to the upside (424.57) can send it to top bollinger band on the daily at 430.37 and then just beyond that is all time highs at 437.32. Then 445 is top bollinger band on the weekly time frame. Also take note that on Lulus cool off days it has been bouncing at the white line. Even it’s green days, when it comes down for the session it has been bouncing on the white line.
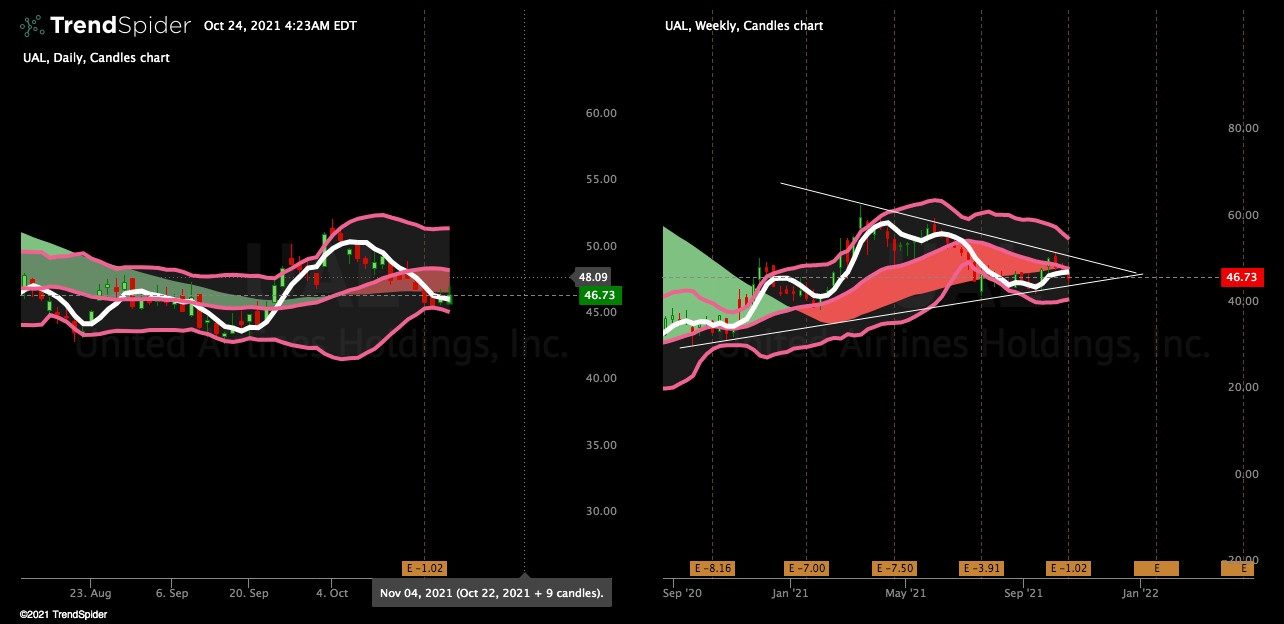
Ual (daily left/weekly right) - Setting up tight on the weekly around mid band. 52 week high is 63.70 but well off all time high which sits at 97.85. Rsi is 41.65 on the daily and 44.65 on the weekly. It is leaning more towards being oversold. Not the easiest to tell if it’s going to break to the upside or downside just yet but I would guess to the upside. Regardless, safest way to play this is to wait til it breaks either the top or bottom trend lines. And play the break out. Also premiums aren’t expensive so going far out expiration with calls to catch more of the break out you can also do. Or if you are leaning puts then far out puts expiration.
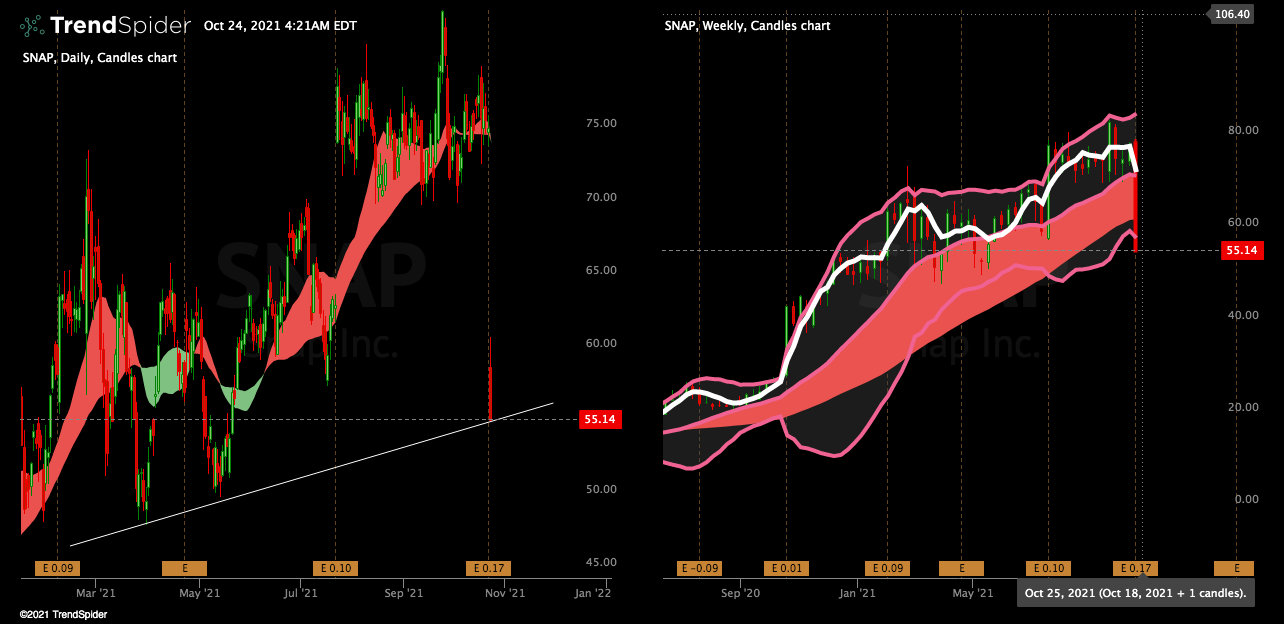
Snap (daily left/weekly right) - Finally snap. Got crushed on earnings this past week. I normally am not the one to jump in and buy an earnings dip this fast. However that is one heck of a gap down. And after zooming out it just so happens that it landed on a long term trend line. Snap premiums like Ual are not expensive either so going with a far out expiration for calls you should make out. Also Fb reports earnings next week. Snap will move with it as Fb moves with snap for its earnings. If Fb beats that can start snap’s move back up. If it falls under the trend line I would scalp puts and then let it settle down. Oversold is an understatement. I’m thinking an after earnings climb happens sooner rather than later with snap.
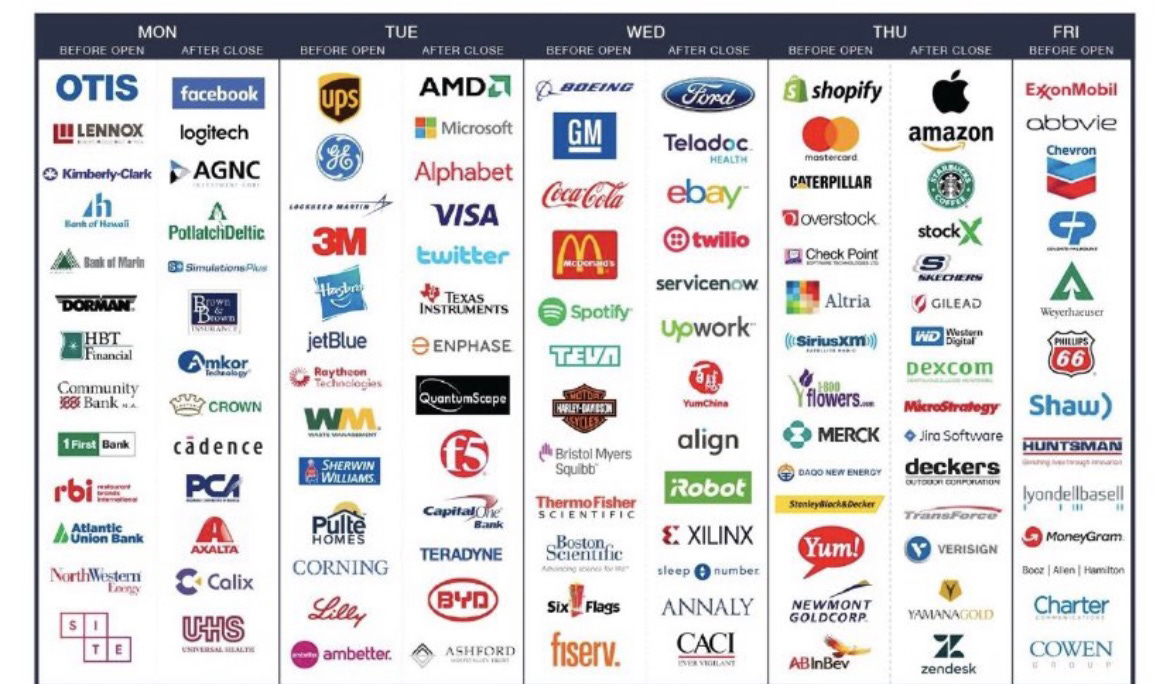
And speaking of earnings I’ll leave you with a picture of the upcoming earnings for the week. Big big names this week!
Take care and happy trading! Drop me a comment and share me please!